Product ID#
Qty.
Buy now

Shopping in Germany can be a completely different experience for people who are used to shop till late at night. The shopping hours in Germany are very limited. What’s more, in most cases you may find your credit and debit cards useless, as there are not many places you can use them for shopping. It is better to equip yourself with an ample amount of ready cash.
However, these are not reasons enough to ward you off shopping for some of the truly German products which you cannot get anywhere else. There are many characteristic items that you may want to buy. But look out for imitations. There are no restrictions in the German markets as to how genuine the products must be. All items...… read more
Oktoberfest is a festival that celebrates the most popu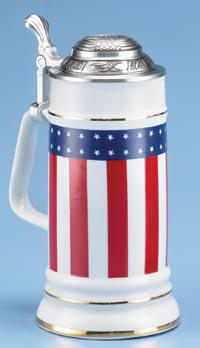 lar liquor in the world – the beer. This festival has undoubtedly originated in Germany, where beer and everything about it are celebrated. Drinking copious amount of beer is the way how the Germans celebrate anything and everything. So it does not come as a surprise that they made the wedding of one of their Princes, Prince Ludwig
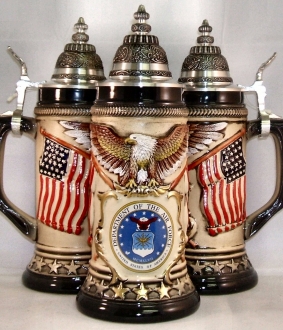 of Bavaria an occasion for revelry.
The Oktoberfest started in 1810 when the Bavarian Prince, Prince Ludwig conducted a huge celebration in connection with his marriage to Princess Therese. The beer literally flowed through the streets of Bavaria. The highlight of the event was a horse race. People enjoyed the occasion so thoroughly that they made this a yearly event and the world’s biggest beer festival stared here.
It was only natural that the German immigrants all over the world began to celebrate this and so Oktoberfest now is a worldwide event now. The German immigrants of America started to celebrate Halloween from the first half of the 20th century. Almost all the states in USA celebrate this beer festival with a verve that is no less than that of their German counterparts. The enthusiasm caught on with the establishment of microbreweries in America. Thereafter authentic German breweries entered the scene to make the festival more authentic...… read more
The crown Prince Ludwig of Bavaria got married to Princess Therese on October 12, 1810. He wanted to share the happiness with his countrymen and invited all of them to a large feast conducted in a large field outside the city gates. Thousands of Bavarians attended it. Food and beer were consumed in large quantities. A horserace also was conducted. In short, people enjoyed themselves beyond measure and the next year, they repeated the event. Thereafter, it became an important volksfestival in Germany. It is now an important feature of the Bavarian culture.
The beer consumed during the Oktoberfest is of a special quality. Now the fest is a 16-day celebration that starts sometime during the second half of September till the first week of October. Every year new features are being added to the festivities of the Oktoberfest. New tournaments, games and agricultural shows are included in this festival...… read more
‘ Stein’ is a misnomer when you consider the real meaning of this word of German origin. The word ‘stein’ is a short form of the German word ‘Steinzeugkrug’, meaning ‘stone jug’. Now the word stein is used for any kind of vessels that are used to drink beer from. It can be made of silver, pewter, porcelain, wood, pottery, glass or it can be stoneware itself.
The initial beer steins were mugs without lids. But the great black plague that affected Europe in the 14th century forced the Europeans to be extra careful about hygiene. The hoards of flies that infested Europe during the fag end of the 14th century made it necessary for them to cover all the things that are to be consumed. This included beer also and by 1500 a law was passed to the effect that the beer steins should possess lids. This is the origin of lidded beer steins.
T he Germans’ partiality towards the beer is world famous. So are their beer steins. It was a mark of prestige for a German to possess a personal beer stein. Most of them used pewter steins and the well-to-do citizens used silver steins. The people of economically lower class used wooden containers or earthenware to drink their beer... … read more
Bavaria celebrates its May Day with an exuberant community event. It is called ‘May pole raising’. As the name indicates it involves raising a long pole, which sometimes reaches a height of 90 meters. This highly laborious work is done manually by a group of able-bodied men. No machinery is used in this. Raising a separate Maypole is each locality started only in the 16th century...… read more
If you are a beer aficionado, you can’t probably afford to miss the spring beer fest in Germany. It is termed as ‘Starkbier’ fest. ‘Stark’ in German means ‘strong’. So this is the festival of ‘strong beers’. This fest has a 500 year old history.
The Christian monks are supposed to observe a 40-day fast during lent. This obviously is very exhausting. So Brother Barnabas with his fellow Paulaner monks, found a way to circumvent this highly exhausting fasting rule, which says that they cannot eat. In 1651 they brewed a special beer with added malt and grains. This made the beer stronger by way of its solid content but not much in the alcoholic content. The monks called it ‘Salvatore’ meaning ‘savior’. This strong beer is also called ‘Flüssiges Brot’ or liquid bread...… read more
King-Werk German beer steins strive to preserve the centuries-old German beer stein craft in its genuinely archaic shapes and designs. The factory is situated at Hohr-Grenzhausen in Westerwald. Germany. This part of Germany is known for its top quality clay deposits. This clay deposits have produced a pottery culture in the area right from the 1st century A.D. Now the area is known all over the word for the traditional German Stein manufacturing.
There are many renowned beer stein makers around the area. King-Werk happens to be one of the largest beer stein manufacturers around. The company was founded by two gentlemen named, Friedrich Wuerfel and Edmund Mueller in 1949. From then on, they had started to produce beer steins that conform to the standards of ‘Ceramic of world reputation’. The German version of the phrase goes, ‘Keramik Internationaler Geltung’. The company made an acronym of this phrase to create a trade mark for their venture and the trade mark ‘KING’ came into existence. The trade mark now stands for quality and authenticity. The name was proved extremely meaningful by their ensuing productions.… read more
Christmas in Germany is a time for celebration and gift exchange, as it is everywhere else in the world. Christmas celebrations and the related rituals and traditions vary greatly in various parts of Germany.
Advent
The Christmas season commences four Sundays before Christmas. This is called ‘advent’. The advent as the name denotes the beginning of the celebrations. Each family makes an advent wreath using the seasonal greens. This wreath is further decorated with colorful ribbons and other decorations. Four candles are placed on the wreath and one is lighted on the first Sunday and an addition candle will be directed each of the ensuing Sundays till Christmas. In some regions the family gathers around the wreath while lighting candles and sing carols.
Advent calendar is also made. This is mainly to help children count down. The calendar is usually made with windows that are covered, so that the children can open them each day and claim the goodies in them...… read more
In Germany, Christmas festivities start a month before Christmas. It starts with the Advent, which falls on the first of four Sundays preceding Christmas. The Christmas mood sets in from that day. Many traditional activities are connected to Christmas in Germany. There were many customs and ceremonies connected to Christmas in the past but the modern celebrations commenced only by the middle of the 19th century.
It starts from lighting the Advent wreath on the first Advent Sunday. This is a wreath, usually made of fir tree branches, with four candles representing four Sundays before Christmas. One added candle will be lit on each Sunday, completing the lighting of four candles on the fourth Sunday. This is the official beginning of the festivities and preparations for German Christmas. … read more
Thewalt German beer steins have an impressive heritage of 117 years behind them. The company was first established as a joint venture of two great masters – Albert Jacob Thewalt and Jean Paulus, in the year 1882. The company was named ‘Paulus & Thewalt’.
But by 1893 Thewalt decided to start his own venture. That was the beginning of a more-than-a century old business. The family business was loyally continued by the old master’s son Albert Johann Thewalt and the third generation business was headed by the grandson Albert Jakob Thewalt.… read more
Beer is Germany’s drink. Copious amount of beer is consumed daily in Germany. It is said that after the ‘Black Death’ the population became extremely dwindled and the grains were surplus. There started the brewing of world’s most popular drink.
In the beginning of the 16th century Wilhelm V, the duke of Bavaria found it very difficult to meet the great demand of the beverage in his own household. So he was advised to start brewing his own beer for his family. Thus, he founded the Hofbrauhaus in 1589.… read more
Zoeller & Born is one of the very few companies that produce German beer steins with 100% German materials. Their entire work force and artists are German. The advantage is that the chances of digressing from the glorious German tradition of beer stein craft is extremely slim.
This family owned company was cofounded in 1956 by Alois Zoeller and Werner Born. Westwald region of Germany is universally famous for its top quality clay deposits. So naturally this became the ancient center of pottery. This later became an equally renowned center of top quality ceramic products. The Zoller & Born is a company that uses only the quality ensured clay of the Westwald region.
Zoeller & Born produces high quality stoneware on the same line of the ancient German art, using the same techniques. They consider it as their responsibility to preserve the age old tradition and quality of the products. The designer department of Zoeller & Born can boast of highly accomplished designers and artists. They are on constant efforts to produce new stein designs and molds.… read more
Thurn and Taxis Palace Festival is an important summer event in Regensburg – Germany. This takes place in an ancient palace which was built between 11th and 14th centuries as the cloister of St. Emmaram. Afterwards, it was converted to the residence of the famous aristocratic family of Thurn and Taxis. This family was responsible for bringing large- scale postal service to Europe. So they were and are still revered in the region.… read more
Visiting museums is always extremely fulfilling because a lot of historical, cultural and artistic knowledge can be gleaned from the visit. You can have a close observation of a countries cultural, social and technical background by visiting its museums. But visiting museums in the night will yield a unique experience. The Long night of museums, Berlin is an extraordinary nocturnal event that is organized in Berlin at the end of September. … read more
This world famous summer event in Germany is the biggest sailing event in the world. The 133rd Kieler Woche is celebrated from 20th to 28th June 2015. This week-long sailing event is celebrated with diverse programmes. This week is also marked by the biggest open-air musical concerts and other performances. Even the children are included in the festivities with their own cultural events and games, conducted in the special park set apart for them.… read more
Rhine in Flames -the name of the festival itself makes it highly intriguing. This is the most popular fireworks fiesta that attracts millions of visitors to Germany during summer. This festival is celebrated at five locations, from June to September, in various cities and towns along Rhine valley. These five sites are Bonn, Rüdesheim, Koblenz, Oberwesel, and St Goar. The fireworks and light-shows make this festival extremely colorful and hence exciting… read more
German beer steins have become more of a collectible item than a functional one now. People collect them as souvenirs and tokens. That is why it is a perfect gift item. You can present the beer steins to commemorate a journey together or take them as mementoes or souvenirs after a memorable journey to gift your friends or relatives.
The German beer steins have all sorts of images on them there are historical images, images of ancient cultures, day-to-day life etc. If you have a friend, who is a religious person, naturally you will want to present him or her with a German beer stein with a religious image. … read more
Since the 14th century, the German beer steins have undergone a number of changes in their shapes, designs and the crafting materials. In the 14th century the beer drinking vessels were made of wood, earthen ware, silver and pewter. The silver and pewter mugs were expensive and could be afforded only by the affluent. The wooden and earthen beer mugs were used by the poor. They did not have lids.
The bubonic plague that struck Europe from 1340 to 1380 brought in an important change to the beer mugs. In 1500 a law was passed in Germany that all the food containers including the beer mugs should have lids. Thus the lidded beer steins came into existence. Most of them had a dome shaped lid fitted with a thumb lever. … read more
Beer is the common man’s drink in Germany. It is considered to be the national beverage of Germany. So the Germans are attached to beer at all levels of their being – physical, emotional and sentimental. Beer is consumed in Germany with such an ardor that it becomes an obsession with the Germans.
Germans take great pride in recounting their centuries-old beer history and the fabulous tradition associated with it. As a result, they will not bear with any kind of tampering with the production or selling of this popular drink. … read more
The ordinary beer mugs turned into beer-drinking vessels called beer steins from the 14th century after the holocaust caused by the bubonic plague from 1340 to 1380. It was found that the main cause of this large scale annihilation of human life was unhygienic conditions prevailed in Europe at that time.
Soon after the plague, a hoard of small flies plagued central Europe. So by the year 1500 a law was passed in Germany that all the food containers should have lids. So the beer mugs also acquired lids fitted with a thumb flick or easy opening of the container. This was the origin of the German beer steins. … read more
In 1810 the crown prince Ludwig got married to Princess Therese of Saxe - Hildburghausen. To honor the couple a large festival was organized and the citizens of Munich took part in the merriment accompanying the royal wedding.
Horse races were conducted in the honor of the royal couple and there was general merriment for many days. The next year also the horse race was conducted and then on it became a custom and thus originated the Oktoberfest which proceeded to become the largest Volksfest or "People’s Fair".
The end of the Black Plague found Europe with lesser population but a huge surplus of grains. These grains were then brewed in large scale and beer became the principal drink. The mugs or tankards used then were made of various materials. The rich people could afford pewter, glass and silver mugs for consuming their liquor while the poor people had to be satisfied with wood and earthen mugs.
Evolution of beer steins with lid
Somewhat large mugs were always used to consume beer. But after the plague, there was a period of a ‘fly-invasion’ in many parts of Europe. People had already found out the importance of hygiene after the bubonic plague. So laws were passed for all the food and … read more
Beer – that frothing golden liquid is one of the oldest beverages developed by man. His consumption of this liquor is recorded in history as early as 5th century BC. Since then it has become the most popular beverage the world over.
The oldest existing beer recipe contains very few ingredients such as water, barley and bread. Beer which was produced and consumed on a domestic scale began to be brewed on a large scale and became a commercial product by 7th century AD. By the end of 19th century beer brewing became a full-fledged industry. … read more
Quintessentially, a question for every beer stein connoisseur: what is it made of? Let’s look at history to find the answer.
A German beer stein in earlier times was finished out of natural materials like pure wood or stoneware. These beer steins were distributed among the patrons in the inns or pubs. These were not sturdy and never lasted long. They would putrefy easily, crack, and break eventually.
As the earthenware beer steins were porous, the material soaked the beer, which gave off a stench subsequently. The ceramic steins are also present from the initial times, but their prices were escalated, so that very few people owned any piece. … read more
One of your most prized collectible since generations, the brilliantly adorned and ornamented german beer stein entails utmost care and handling the priceless piece dexterously. Let’s discuss the vital aspects of proper display and cleaning these gorgeous objects of vanity.
Display your beer steins with closed lids, as they ward off the aging course and the incessant damage in comparison to open lids exhibits. Closed lids prevent oxidation of the interior body of the stein and hence stop the irrevocable staining process on the steins. … read more
Why Authentic Beer Steins are an Excellent Gifting Idea
Birthdays and weddings are happy occasions nevertheless but for the ones who are invited to be a part of the celebration, ‘what to gift’ often becomes a dilemma that takes a little fun out of the excitement.
Most of us would like our gift to be something unusual that can be remembered and kept as a memoir for years to come, but with every passing wedding, the ideas get repetitive and thus the need to find fresh ones, bigger.
Emerging from this very need is the concept of gifting an authentic beer stein. If the birthday boy or groom in question is a beer lover or even a beer drinker, he will absolutely love this unusual yet very useful gift and will probably own and treasure it for as long as he can. … read more
Whether you are buying them to add to your collection of souvenirs or for the purpose of consuming your favourite beverage, either way it is important that when purchasing German heritage beer steins, you are equipped with enough knowledge to pick the ones that are original and authenticated and not end up with the ones that are cheap but ‘hard to tell apart’ copies.
Just like most other collectibles that could cost hundreds of dollars, authentic beer steins too could be an expensive purchase and would cost anywhere upward of $110 where as spin-offs and imitations could cost far less. The price is thus one of the biggest indicators of their genuineness. … read more
Most of you would not be aware that the beer changes its aroma, taste and color as it is being poured into a glass.
The glassware that is used to drink different kinds of beer could reflect national traditions, it may be a form of art, or it could be for easy maintenance such as washing, stacking and avoiding breakage. It could also reflect legislation regarding serving measures, used in drinking competitions or used as a novel product to drink.
The froth created by serving a beer acts as a net for many of the volatiles in a beer. Compounds such as all kinds of yeast, hop oils and byproducts like fruity esters, alcohol, fusels and spices are called volatile substances. These tend to escape from the beer while being poured. So a glass that creates healthy foam head helps in trapping these volatiles. … read more
There are always special occasions where you want to gift your loved ones something unique. You want this present to be affordable, functional and most importantly personalized. Weddings and birthdays are happy occasions wherein those who are invited to be a part of the celebration are always on the hunt for memorable gifting ideas.
Personalized beer glasses make a practical gift that one can enjoy. If the birthday boy or groom in question is a beer lover he will absolutely love this unusual yet very useful gift. He will probably own and treasure it for as long as he can. From pilsners, tumblers, steins, mugs and tankards, you can personalize your gift right down the shape of the glass. … read more
Attending the Oktoberfest in Munich and sipping on a cold one in one of the German pewter beer steins has been your lifelong dream that is finally coming true! However, with millions of other equally thrilled visitors, some of whom are regulars, who flock to the grounds to enjoy the fabulous beers, German foods and activities that take place; having a basic strategy can always help. … read more
With a myriad of styles and types of beers that exist in the world, the biggest question with respect to serving revolves around the temperature. In most cases, drinkers have their own preferences that may be varying. This is possible since there aren’t many stringent norms with respects to the ideal serving temperatures as experienced with wine.
Said that, this is a general guide on what is the universally accepted norm that is in no way an absolute truth. … read more
The first significant collections of beer steins date back to the mid 1800s where museums sought out examples of exquisite art from the Renaissance. It was after this that private collectors started cropping up willing to pay surprisingly high prices for the right steins.
If you intend to buy a stein only on an occasional basis and are flexible about the nature and type of the stein, then you can simply visit antique shops and shows to find the best pieces. On the other hand, if you have specific objectives with regards to creating a planned collection, it would be ideal to start working towards developing contacts of other collectors and dealers who have the knowledge that you can trust. … read more
Attending the world famous Oktoberfest in Munich has been on your bucket list for quite some time. But with each passing year you just don’t know when you will ever be able to make the trip. So what? With a little bit of enthusiasm and some basic planning, you can easily host an Oktoberfest celebration on your own this autumn!
The real Oktoberfest is kicked off with the tapping of a beer keg. The festival consists of exquisite German food, music, dance, rides and a whole lot of beer. Following these steps will allow you to throw one of the most unforgettable Oktoberfest celebrations in town! … read more
The last time you were on a trip to Germany, you chanced upon some exquisite beer steins for sale. Now that you are home, you are not sure if your collectibles are real vintage steins made in the old fashioned way.
An evident indicator of the authenticity of your German steins is the price. Obviously, the cost of an authentic stein will be very different from … read more
German Beer steins are traditional stoneware beer mugs. They are beautifully ornamented and usually sold as collectibles or souvenirs. The word stein is derived from the German word “Steingut” which means stoneware.
The Government had enacted a law to prevent the great black/bubonic plague from recurring which had hit Europe in 14th century. This law stated that all beverage containers must be covered when the drink is not being consumed. The German beer glasses were a creation which came out of the necessity put forward by this law … read more